Different Methods To Measure CAC – What Each Method Says (And Doesn’t Say)

By Larry Cheng, Managing Partner @Volition Capital
Recently, we were having an internal debate about the merits of a particular investment. One of the reasons not to invest was that CAC was going up. However, one of the reasons to invest was that CAC was going down.
How can reasonably competent people arrive at such polar opposite conclusions on the same company? Here’s how and what we can learn about the strengths and weaknesses of different CAC calculations.
Two ways to measure cac
Generally speaking, B2B companies look at CAC one way (“Overall CAC”), while B2C companies will look at it that way as well, they also have an additional way to look at CAC which focuses on the cost to acquire the next customer (“Marginal CAC”). We will explore both approaches as they both have their strengths and weaknesses, and they both answer important but different questions. Therefore, whether CAC is going up or down depends on what question you are asking.
Measuring Overall CAC: The B2B CAC Equation
Here’s the equation many B2B companies use to derive CAC:
Total Sales and Marketing Spend / New Customers Acquired = CAC
This is a tried and true equation. The strength of this question is it is fully burdened. Every expense related to sales and marketing headcount, marketing program spend, inside sales, outside sales, sales development reps – everything is included. It is the all-inclusive equation, and therefore it is the authoritative CAC metric, right?
Not exactly. Strangely, what this equation doesn’t tell you is how much it costs to acquire your next customer (marginal CAC). For example, let’s presume the actual numbers for a given company were:
$5,000,000 (total sales and marketing spend) / 1,250 (new customers acquired) = $4,000 (CAC)
Does this mean that the company could spend $4,000 and acquire another customer? Unlikely, because B2B companies, especially ones that are sales rep driven, don’t make sales and marketing investments in $4,000 increments. They either have to hire a $100k+ sales rep or not. They either have to spend $50k on the trade show or not. Even if the company does spend $100k on a new sales rep, does that mean they will acquire 25 new customers ($100,000 spend / $4,000 CAC) from that spend? Probably not given the variance in sales rep performance – this metric is just not that direct and linear of a metric.
Therefore, CAC in a B2B context is used more as an input into LTV:CAC to show the generalized efficiency of sales and marketing spend. That is why if you talk to B2B companies and investors, they are much more likely to know their LTV:CAC ratio than their absolute CAC in dollar value terms because implicitly they know that the Overall CAC calculation isn’t really the cost to acquire the next incremental customer – it’s more of an input to understand efficiency. When you use this CAC equation and map it against LTV, it answers the fundamental and general question of whether a company’s overall sales and marketing spend is efficient – this is very important, but also incomplete.
Measuring Marginal CAC: The B2C CAC Equation
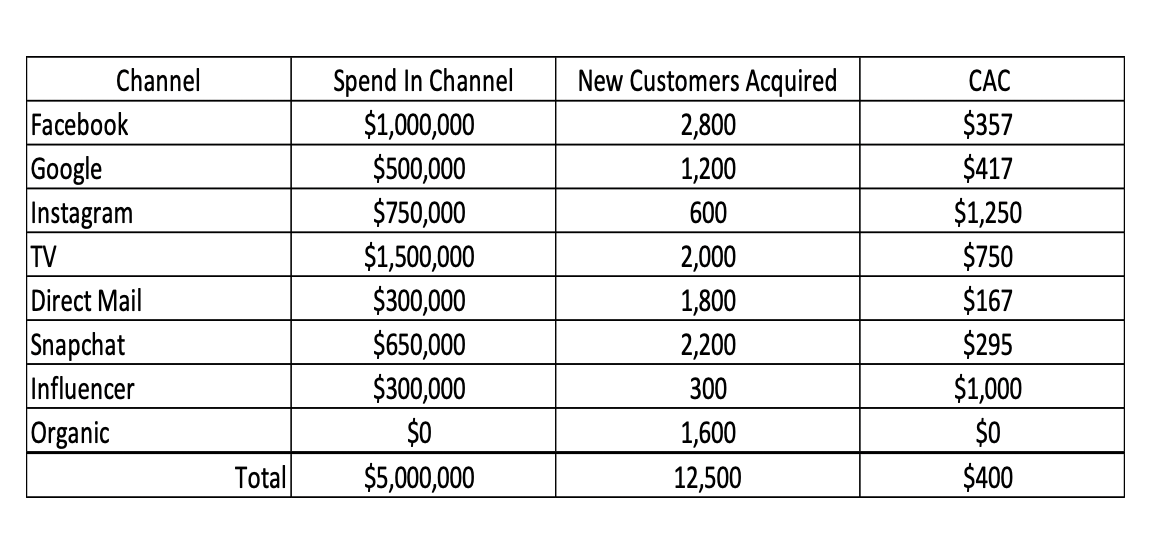
While B2C companies will definitely use the Overall CAC equation, they also think about Marginal CAC. Here’s how many B2C companies think about Marginal CAC (at the highest level), especially those that are more marketing-centric, which is commonly the case with consumer companies:

In this example, the Overall CAC may be $400, but it may be that if you wanted to acquire the very next customer, you might spend $295 on Snapchat. Or maybe you’d send out another direct mail campaign which given historical performance you know will convert at a <$200 CAC. Therefore, in this case, the Overall CAC number of $400 doesn’t answer the Marginal CAC question of how much it would be to acquire the next customer. To understand Marginal CAC, you would need to look specifically within each channel to find the most efficient use of marketing capital. B2C marketers know with high accuracy how much it costs to acquire their next customer – what they might not know is how much it will cost to acquire their next 10,000 customers.
It is notable that marketing and sales headcount costs should be included in the “spend in channel” total, but it usually isn’t an impactful inclusion for efficient B2C companies. Many consumer companies don’t have sales reps so their sales and marketing spend is weighted strongly towards marketing program spend. And, given that marketing usually has greater scalability than sales – program spend can simply be increased with similar marketing headcount – headcount costs generally aren’t as much the driver of CAC in consumer companies as they are in B2B companies.
So, How Can Cac go up and down at the same time?
In the scenario we discussed at the beginning – Overall CAC was going up and Marginal CAC was going down in the same company. How can that happen? Speaking generically, the most common reason for Overall CAC to go up is due to the hiring of fixed headcount costs in sales and marketing that are not yet efficient or ramped. This leads to an increase in Overall CAC while those resources hopefully bear fruit over time in greater customer acquisition. While the most common reason for Marginal CAC to go down is that specific customer acquisition channels are both operating at greater efficiency than the whole yet aren’t being or haven’t been meaningfully scaled yet. Both of these happened to be true at the same time for the company in question.
So who is more right? Is CAC going up or down? Both are true and both are incomplete. Overall CAC going up is due to a moment in time investment in sales and marketing headcount which may or may not bear fruit in the future. Marginal CAC is going down because specific acquisition channels are operating more efficiently today, but that may or may not continue to be efficient in the future. Only time will tell which metric is more predictive, but it is always important to appreciate the strengths and weaknesses of both Overall CAC and Marginal CAC equations.
[What are your insights on how to think about CAC? When has measuring CAC in either approach taken you down the right path or the wrong path? What’s another way of thinking about CAC from your experience? Please share your thoughts in the comment box below, and if you have any other questions you’d like me to write about – please email me at asklarry@volitioncapital.com.]

